Recently I saw an advertisement about Mutual Funds. As a CFA candidate, I found them funny. Well, you will also think the same if you understand the language.
By the time he finished his samosa, he understood that Mutual Funds give you easy access to your money! Check it out here. pic.twitter.com/urhQqdGhZs
— Mutual Funds Sahi Hai (@MFSahiHai) May 29, 2017
I don’t have any objection to making an advertisement for Mutual funds. But the way this advertisement makes it, I don’t know what to say. Then there is this one sentence.
Remember : Mutual Fund investment are subject to market risk.
— Kunal Gupta ॐ (@kunalgupta07) July 10, 2013
I don’t even remember how many times I saw jokes about it.
It makes me write this blog post.
Mutual Funds are a handy way to invest. But many people, even AMFI, The association of Asset Management in India, are doing it all wrong. I don’t find anything about risk in all such advertisements. So why am I telling you about it? Every child in India knows that “Mutual Funds Investments are subject to market risk.” But no one knows what it means.
So, How do we analyze the risk of Mutual Funds, and how do we assess expected returns?
R Squared: How much is the data is valuable and faithful
R square or Coefficient of determination is significant in analyzing the future performance of the stock, ETF, or even mutual fund. Simply put, it tells you if the data is faithful and how much.
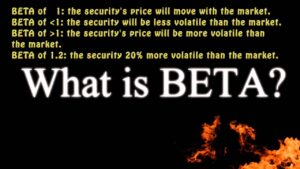
In more simple words, you may be aware of the term beta. If you are not, don’t worry. It’s one of the five risk measures we will check in this post. Beta tells you that if Benchmark, which is generally an index like S&P 500, Sensex, or Nifty, moves 1% in one direction, then how much security will move.
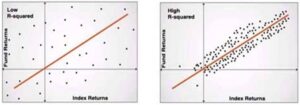
Now, there are no superfine calculations to do that. Let’s say security X has Beta 1.5. The index moved seven units. As per calculation, security is supposed to move 10.5 units. But it may or may not be accurate. It may increase by 10, 9, 4 or even decrease also. R squared is trying to tell you how much percentage possibility is that future data will follow the beta correlation in simple language.
 The image clearly shows that the right idea is better for predicting the future, whereas it’s complicated if you want to try with the left image.
Generally, it is shown like 0.18 or 0.60 or in percentage format Like 18% 60%. It’s always between 0 and 1 or less than 100% Rule of thumb in R Square, or the Coefficient of determination is higher, the better. As per Morningstar, above 85% is good.
Beta: Volatility
 Beta is a systematic risk investor is facing for holding a security or Portfolio like Mutual Fund or ETF and not the market as a whole. That is what the definition is telling you. Please ignore it. Take it this way.
Let’s say you are holding SBI, State Bank of India. The stock is part of both large-cap equity indices in India, S&P BSE Sensex and NIFTY. So when you are buying the only stock of SBI, you are not buying another 50 stocks in nifty and 29 stocks in Sensex. So it’s better to take it that the price movement of SBI may be different than SENSEX. Which it is. Let’s say that 1.8. That means when Sensex goes up by 1%, SBI will move up by 1.8%. But it’s not necessary. So how much is predictable? There comes R squared. If R squared is above 85%, it’s excellent. Less than 85% but above 60%, still good. Many will say lower than 60% is terrible.
The beta itself will give you some good information about risk and return. Let’s say that Sensex is giving you a 12% return. So with 1.8 betas, SBI is supposed to provide you with a 21.8% return. That is because you are investing in specific stocks and taking particular risks for that business. As its long-term beta on SBI, its expected return on the stock is LONG TERM.
One more thing about beta, and I am done with beta. YES, you can calculate Daily beta, but they are useless.
Alpha: Measure of return on a risk-adjusted basis
Tracking error in an index fund is nothing but Alpha.
What is Alpha? Excess return made on the portfolio, with the risk-adjusted profile.
In simpler words, Sensex made 12%, and SBI made 24%. So Alpha is12%. Now you can understand what a tracking error is and why it occurs. Some mechanism changes the index funds as the portfolio is altered. Say there is the new addition of Kotak bank in Sensex. Now, in theory, there is no cost. So even if there is a change, the index will not be different. But in real life, there are costs for buying and selling stocks. So when MECHANISM does that, there is some difference. Either it’s better or worse than the index. So if you are investing in an Active management fund and having negative Alpha, why are you even investing? Buy ETF. That’s it.
Standard Deviation: How much final result can deviate
Standard deviation is a measure of the dispersion from its mean. Its square root of variance determines variation between each data point relative to the norm.
Once again, please ignore it.
What is this telling you to say you expect a 15% return on investment? But it is not sure that you will get the same. How much return will you get? What are the possibilities?
There will be a range in which you will get a return. Say 10%-20%. How do you determine it? What does history say about it? Say historically; one Mutual fund has a deviation of 2%. Another is 5%. Here 5% is riskier, and that’s why you may receive more and better return potential.
Sharpe Ratio: Measure of risk-adjusted return
In simple words, Sharpe Ratio is telling you what you will earn by taking 1 unit of risk.
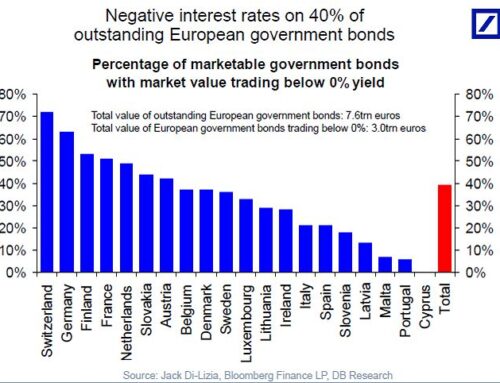
In simple words, Risk-Free Rate is the rate that compensates for some risk. There is just no or negligible risk on such investments. The best example is Govt securities. Like treasury securities in the US, Govt 10-year bonds in India. The simple reason is Govt can’t default, and such securities are sufficient liquid, which means you can sell them at any time. So they will give you the return necessary to outperform inflation. But that is not sufficient when it comes to generating wealth. You are supposed to make something more. But the question is, at what cost? By taking how much risk? There are many ways to calculate risk like beta, standard deviation, etc. I don’t want to go into more difficult terminology.


